20
22
The Elephant’s
year in review
Of trilogy at
Redmond Ridge

Compliments of
Devin Sanford
Your Premium Service Realtor
For 19 years
11th Edition
Hello, everyone.
I’m very happy to finally be getting this information delivered to you. I think everyone is well aware of the craziness that went on in the first half of the year with Trilogy sales.. In the first half of the year, we were still seeing rising prices due to low inventory, however the likelihood of the Fed. Raising them was circulating in the air and in the second half of the year, it came true. Over a six-month period, mortgage interest rates went from about 3% to 7% and with the price of homes still rising many who could not pay cash, were priced out of the market and inventory began to grow. 2022 ended with a whimper rather than a bang.
For the first half on the year, we struggled to keep two weeks’ worth of inventory and buyers were waiving inspections, R.C.A. review periods, releasing large earnest money deposits early to the Sellers and anything to have their offer chosen. As rates began to rise, so did the inventory. We began to see buyers becoming selective as this happened, and buyer home inspections came back into play and earnest money was not applied to the sale until closing. As the year ended inventory hovered around two months.
With most of the lagging listed homes will be sold over the next couple of months, inventory will be bleak and Spring promises to bring a flurry of new homes for sale as interest rates are already beginning to ease up. Competition will increase among sellers, and this should help create a more balanced market.
I’m going to keep it simple this year as most everyone knows what’s going on. With that in mind, here are the statistics for sold homes during 2022. This is my twelfth year in a row of providing this data to every Trilogy member. I hope you enjoy it and will call me personally with any questions. I’d love to be your go to guy for all your residential real estate needs.
Year End Catch Up…
November 2022 Cultivated Four Sales…
| Model | NWMLS Number | Square Footage | Original Asking Price | Asking Price When Sold | Final Sale Price | Days on Market | Dollar Per Square Foot | Final Sale Percentage of Original Asking Price |
| Chelan | 2012737 | 1,300 | $$612,266 | $612,266 | $612,266 | 1 | $470.97 | 100% |
| Washington | 2000304 | 1,900 | $950,000 | $950,000 | $930,000 | 14 | $489.47 | 97.89% |
| Bainbridge | 2011906 | 1,870 | $1,000,000 | $1,000,000 | $990,000 | 6 | $529.41 | 99% |
| Vancouver | 1992241 | 1,920 | $1,195,000 | $1,195,000 | $1,040,000 | 53 | $541.67 | 87.03% |
December ’22 Created Four More …
| Model | NWMLS Number | Square Footage | Original Asking Price | Asking Price When Sold | Final Sale Price | Days on Market | Dollar Per Square Foot | Final Sale Percentage of Original Asking Price |
| Washington | 1986838 | 1,900 | $$686,397 | $686,397 | $680,400 | 66 | $358.11 | 99.13% |
| Townsend | 1985724 | 1,330 | $825,000 | $769,950 | $750,000 | 64 | $563.91 | 97.41% |
| Hemlock | 2016882 | 2,320 | $1,589,000 | $1,589,000 | $1,550,000 | 6 | $668.10 | 97.55% |
| Maryhill | 2005645 | 3,360 | $1,798,000 | $1,798,000 | $1,650,000 | 14 | $491.07 | 91.77% |
When we see odd asking prices which are significantly lower than what we’re accustomed to seeing, it’s very likely we’re looking at an affordable housing home through the Regional Coalition for Affordable Housing. ARCH is a partnership of the County and East King County Cities working to preserve and increase the supply of housing for low- and moderate-income households in the region. If you have questions about this or anything else, I’m happy to answer any questions you may have. I’ve helped build and sell numerous ARCH homes in Trilogy.
Four Lounged in Escrow Before New Year’s
| Model | NWMLS Number | Square Footage | Original Asking Price | Asking Price When Sold | Dollars/Square Foot | Days on Market | Comments: |
| Washington | 1986838 | 1,900 | $$686,397 | $686,397 | $361.26 | 66 | ARCH Restrictions Apply |
| Townsend | 1985724 | 1,330 | $825,000 | $769,950 | $578.91 | 64 | Twinberry Way fourplex |
| Hemlock | 2016882 | 2,320 | $1,589,000 | $1,589,000 | $1,550,000 | 6 | Greenbelt Cul-de-Sac Lot |
| Maryhill | 2005645 | 3,360 | $1,798,000 | $1,798,000 | $535.12 | 14 | Golf Course by Clubhouse |
Four homes were under contract at month end. The Washington plan falls under the King County Coalition for Affordable Housing guidelines and restrictions. Being that the home did not sell within 60 days, the income and occupancy restrictions have now expired. However, other stipulations still apply, and the buyer must be approved by A.R.C.H.. These four ended up being our final closings for 2022.
Two Left for Sale at Year End
| Model | NWMLS Number | Square Footage | Original Asking Price | Current Asking Price | Dollars/Square Foot | Days on Market | Mentionable |
| Chelan | 2012751 | 1,295 | $$799,000 | $799,000 | $616.99 | 60 | Backs to Mesa Wall |
| Vancouver | 2012738 | 1,975 | $998,000 | $998,000 | $505.32 | 57 | Greenbelt Site |
I’ve been receiving Devin’s monthly Market Reports on the sales of homes in Trilogy at Redmond Ridge for 10+ years and found it extremely useful in understanding and keeping pace with how the real estate market is doing in the Seattle/Redmond area from Southern Cal. So, when I was ready to sell my home in Trilogy, Devin was the only broker I wanted to work with given his tremendous knowledge and expertise of that particular community. Devin totally guided me through the sales process with professionalism and courtesy. I was amazingly comfortable working with him even though I was 1200 miles away. Bottom line, You’re safe with Devin Sanford!
Ms. Cheng, Trilogy Home Seller
72 Closings for 2022
“Be a yardstick of quality. Some people aren’t used to an environment where excellence is expected.”
– Steve Jobs
A Recap of 2022 Month over Month Statistics:
| Jan | Feb | Mar | Apr | May | Jun | Jul | Aug | Sep | Oct | Nov | Dec | YTD | |
| $old | 2 | 2 | 9 | 5 | 9 | 7 | 5 | 11 | 7 | 7 | 4 | 4 | 72 |
| Pending | 2 | 3 | 2 | 7 | 7 | 11 | 12 | 6 | 6 | 3 | 5 | 4 | |
| Active | 0 | 1 | 2 | 6 | 6 | 10 | 8 | 8 | 8 | 6 | 7 | 2 | |
| $old D.O.M. | 4 | 5 | 6 | 4 | 4 | 13 | 9 | 30 | 37 | 53 | 19 | 38 | |
| Active D.O.M. | n/a | 5 | 1 | 9 | 17 | 23 | 33 | 33 | 36 | 18 | 29 | 59 |
Trilogy Sales Over the Last Decade
| 2012 | 2013 | 2014 | 2015 | 2016 | 2017 | 2018 | 2019 | 2020 | 2021 | 2022 | 2023 | |
| Resales | 87 | 103 | 99 | 102 | 120 | 104 | 102 | 78 | 99 | 105 | 72 | ? |
| Shea Homes New Construction | 10 | 9 | 3 | |||||||||
| Total $old | 97 | 112 | 102 | 120 | 104 | 102 | 78 | 99 | 105 | 72 | TBD |
Final Thoughts
At 2021-year end, the Pachyderm predicted “Trilogy appreciation to hover around 10%”. The latest NWMLS Press Release reports the median home sale price for all of 2022 was nearly 8.9%. This is a very respectable number, in my opinion. We can’t expect to be spoiled forever as we have in recent years.
Speaking of spoiling you, I’d love the opportunity to do that. I don’t rush through creating a stunning home presentation and marketing package for you and leave; I work your prospects thoroughly, professionally, and tactically to get you your full asking price and often more. In running calculations in my Excel spreadsheets of NWMLS and other data, here’s an interesting fact. There were a lot of different Listing Agents that sold the 72 homes in Trilogy last year. The conventional Listing Brokers averaged 102.16% of the asking price as the final price when all was said and done. The local discount brokers cluttering our streets with open house signs averaged 98.77% or 3.39% less than the conventional brokers so, on average, the Sellers didn’t save anything, and I wonder, could they have made more.
Obviously, from the creation of these Year in Review Reports and the monthly reporting during the rest of the year, I’m willing to work. Please, be sure and see a list of my team’s services. Currently we’re remodeling a home and creating a driveway turnaround for a client with zero money out of their pocket to closing and they’re predicted to receive $127,000 more for their home than they’d get as is. The best part is, they don’t have to call a soul or lift a finger, we get it done fast and we do it right. Ask me how.
Here’s a Breakdown of the Plans that Sold
| Collection | MLS# | Sq. Ft. | Orig. Price | List Price | Sold Price | Sold Percent | $ Per Sq. FT. | Date Sold | D.O.M. |
| Port Collection | |||||||||
| Angeles | 0 | ||||||||
| Townsend | 1931922 | 1340 | $850,000 | $850,000 | $845,000 | 99.41% | $630.60 | 6/2/22 | 6 |
| Townsend | 1985724 | 1330 | $825,000 | $769,950 | $750,000 | 90.91% | $563.91 | 12/6/22 | 64 |
| Discovery | 1877436 | 1350 | $850,000 | $850,000 | $960,000 | 112.94% | $711.11 | 2/15/22 | 5 |
| Discovery | 1891873 | 1350 | $875,000 | $825,000 | $840,000 | 96.00% | $622.22 | 3/25/22 | 9 |
| Discovery | 1914135 | 1350 | $835,000 | $835,000 | $850,000 | 101.80% | $629.63 | 5/16/22 | 3 |
| Discovery | 1923735 | 1365 | $895,000 | $895,000 | $930,000 | 103.91% | $681.32 | 5/24/22 | 5 |
| Discovery | 1969066 | 1350 | $879,000 | $879,000 | $875,000 | 99.54% | $648.15 | 8/31/22 | 10 |
| Discovery | 1968247 | 1365 | $875,000 | $875,000 | $887,500 | 101.43% | $650.18 | 8/30/22 | 10 |
| Discovery | 2002751 | 1350 | $872,500 | $872,500 | $872,500 | 100.00% | $646.30 | 9/30/2 | 0 |
| Discovery | 1976980 | 1350 | $950,000 | $950,000 | $950,000 | 100.00% | $703.70 | 9/15/22 | 12 |
| Orchard | 1904171 | 1440 | $889,000 | $889,000 | $875,000 | 98.43% | $607.64 | 4/26/22 | 7 |
| Orchard | 1911849 | 1430 | $789,000 | $789,000 | $825,000 | 104.56% | $576.92 | 5/4/22 | 5 |
| Madison | 1931922 | 1810 | $949,999 | $949,999 | $963,000 | 101.37% | $532.04 | 6/9/22 | 6 |
| Madison | 1958365 | 1810 | $1,050,000 | $1,050,000 | $1,025,000 | 97.62% | $566.30 | 8/3/22 | 7 |
| Lakes Collection | |||||||||
| Chelan | 1896086 | 1300 | $798,000 | $798,000 | $850,000 | 106.52% | $653.85 | 4/14/22 | 5 |
| Chelan | 110522 | 1300 | $553,584 | $553,584 | $553,584 | 100.00% | $425.83 | 6/3/22 | 5 |
| Chelan | 1941448 | 1300 | $850,000 | $850,000 | $850,000 | 100.00% | $653.85 | 7/1/22 | 9 |
| Chelan | 2012739 | 1300 | $612,266 | $612,266 | $612,266 | 100.00% | $470.97 | 11/29/22 | 1 |
| Union | 1895629 | 1510 | $925,000 | $925,000 | $900,000 | 97.30% | $596.03 | 3/31/22 | 12 |
| Union | 1884628 | 1510 | $958,000 | $958,000 | $1,307,500 | 136.48% | $865.89 | 3/17/22 | 5 |
| Union | 1919803 | 1510 | $1,295,000 | $1,150,000 | $1,000,000 | 77.22% | $662.25 | 6/27/22 | 19 |
| Union | 1985681 | 1510 | $975,000 | $939,900 | $939,900 | 96.40% | $622.45 | 10/19/22 | 30 |
| Sammamish | 0 | ||||||||
| Washington | 1894986 | 1900 | $850,000 | $850,000 | $875,000 | 102.94% | $460.53 | 3/25/22 | 6 |
| Washington | 1909807 | 1871 | $875,000 | $875,000 | $895,000 | 102.29% | $478.35 | 5/3/22 | 10 |
| Washington | 1946167 | 1990 | $950,000 | $950,000 | $1,060,000 | 111.58% | $532.66 | 7/21/22 | 3 |
| Washington | 2000304 | 1900 | $950,000 | $950,000 | $930,000 | 97.89% | $489.47 | 11/15/22 | 14 |
| Washington | 1986838 | 1900 | $686,397 | $686,397 | $680,400 | 99.13% | $358.11 | 12/9/22 | 66 |
| Island Collection | |||||||||
| Vashon | 1875083 | 1601 | $950,000 | $950,000 | $1,221,000 | 128.53% | $762.65 | 1/24/22 | 6 |
| Vashon | 1878535 | 1570 | $950,000 | $950,000 | $1,055,000 | 111.05% | $671.97 | 2/1/22 | 4 |
| Vashon | 1881030 | 1560 | $968,000 | $968,000 | $970,000 | 100.21% | $621.79 | 3/7/21 | 9 |
| Monaco | 1879512 | 1590 | $989,000 | $989,000 | $1,000,000 | 101.11% | $628.93 | 3/1/22 | 4 |
| Monaco | 1988109 | 1590 | $985,000 | $985,000 | $985,000 | 101.11% | $628.93 | 9/23/22 | 1 |
| Whidbey | 1894772 | 1680 | $1,188,000 | $1,188,000 | $1,360,000 | 114.48% | $809.52 | 3/15/22 | 4 |
| Whidbey | 1906971 | 1695 | $1,385,000 | $1,385,000 | $1,385,000 | 100.00% | $817.11 | 3/24/22 | 0 |
| Whidbey | 1915901 | 1670 | $1,299,000 | $1,050,000 | $1,000,000 | 76.98% | $598.80 | 8/22/22 | 106 |
| Whidbey | 1963241 | 1671 | $1,025,000 | $1,025,000 | $1,025,000 | 100.00% | $613.41 | 8/12/22 | 3 |
| Whidbey | 1943535 | 1660 | $1,250,000 | $1,175,000 | $1,150,000 | 92.00% | $692.77 | 8/18/22 | 26 |
| Whidbey | 1957911 | 1680 | $1,070,000 | $1,025,000 | $998,000 | 93.27% | $594.05 | 9/23/22 | 63 |
| Whidbey | 1982623 | 1670 | $998,500 | $998,500 | $1,075,000 | 107.66% | $643.71 | 9/1/22 | 2 |
| Bainbridge | 1875828 | 1860 | $1,088,000 | $1,088,000 | $1,311,000 | 120.50% | $704.84 | 1/31/22 | 2 |
| Bainbridge | 1914617 | 1870 | $1,295,000 | $1,295,000 | $1,295,000 | 100.00% | $692.51 | 5/20/22 | 5 |
| Bainbridge | 1914366 | 1860 | $1,298,000 | $1,298,000 | $1,350,000 | 104.01% | $725.81 | 5/16/22 | 1 |
| Bainbridge | 1942090 | 1850 | $1,225,000 | $1,225,000 | $1,175,000 | 95.92% | $635.14 | 7/6/22 | 7 |
| Bainbridge | 1966543 | 1870 | $1,300,000 | $1,199,000 | $1,175,000 | 90.38% | $628.34 | 8/23/22 | 46 |
| Bainbridge | 1960271 | 1870 | $1,175,000 | $1,150,000 | $1,125,000 | 95.74% | $601.60 | 9/22/22 | 49 |
| Bainbridge | 2011906 | 1870 | $1,000,000 | $1,000,000 | $990,000 | 99.00% | $529.41 | 11/23/22 | 6 |
| Nice | 0 | ||||||||
| Vancouver | 1908171 | 1950 | $1,388,000 | $1,388,000 | $1,400,000 | 100.86% | $717.95 | 4/19/22 | 5 |
| Vancouver | 1911052 | 1930 | $1,195,000 | $1,195,000 | $1,208,000 | 101.09% | $625.91 | 5/24/22 | 4 |
| Vancouver | 1910724 | 1920 | $1,295,000 | $1,250,000 | $1,200,000 | 92.66% | $625.00 | 6/16/22 | 39 |
| Vancouver | 1965720 | 1910 | $998,000 | $998,000 | $975,000 | 97.70% | $510.47 | 8/9/22 | 63 |
| Vancouver | 1955833 | 1870 | $1,098,000 | $1,098,000 | $1,060,000 | 96.54% | $566.84 | 8/10/22 | 44 |
| Vancouver | 1989428 | 1870 | $1,185,000 | $1,185,000 | $1,185,000 | 100.00% | $633.69 | 10/6/22 | 1 |
| Vancouver | 1992241 | 1920 | $1,195,000 | $1,195,000 | $1,040,000 | 87.03% | $541.67 | ||
| Forest Collection | |||||||||
| Hemlock | 1892965 | 2170 | $1,695,000 | $1,695,000 | $1,890,000 | 111.50% | $870.97 | 3/31/22 | 1 |
| Hemlock | 1923103 | 2290 | $1,588,000 | $1,588,000 | $1,588,000 | 100.00% | $693.45 | 6/15/22 | 5 |
| Hemlock | 1939674 | 2160 | $1,775,000 | $1,775,000 | $1,725,000 | 97.18% | $798.61 | 7/6/22 | 7 |
| Hemlock | 1993727 | 2305 | $1,388,000 | $1,250,000 | $1,265,000 | 91.14% | $548.81 | 10/28/22 | 76 |
| Hemlock | 1983864 | 2170 | $1,695,000 | $1,695,000 | $1,565,000 | 92.33% | $721.20 | 10/24/22 | 29 |
| Hemlock | 1923213 | 2155 | $1,499,000 | $1,499,000 | $1,489,000 | 99.33% | $690.95 | 9/26/22 | 96 |
| Hemlock | 2016882 | 2320 | $1,589,000 | $1,589,000 | $1,550,000 | 97.55% | $668.10 | 12/9/22 | 6 |
| Cedar | 1914367 | 2305 | $1,498,000 | $1,498,000 | $1,650,000 | 110.15% | $715.84 | 4/28/22 | 0 |
| Maple | 1966543 | 2520 | $1,559,000 | $1,559,000 | $1,500,000 | 96.22% | $595.24 | 8/17/22 | 3 |
| Maple | 1970938 | 5580 | $1,549,000 | $1,519,000 | $1,440,000 | 92.96% | $258.06 | 10/28/22 | 71 |
| Maple | 2001162 | 2575 | $1,495,000 | $1,495,000 | $1,450,000 | 96.99% | $563.11 | 10/31/22 | 105 |
| Alder | 1935140 | 2615 | $1,498,888 | $1,498,888 | $1,498,888 | 100.00% | $573.19 | 6/27/22 | 8 |
| Estate Collection | |||||||||
| Monticello | 1930061 | 2695 | $2,000,000 | $2,000,000 | $2,000,000 | 100.00% | $742.12 | 5/6/22 | 0 |
| Monticello | 1943517 | 2700 | $1,795,000 | $1,745,000 | $1,700,000 | 94.71% | $629.63 | 7/13/22 | 20 |
| Monticello | 1942175 | 2695 | $1,425,000 | $1,600,000 | $1,500,000 | 105.26% | $556.59 | 10/14/22 | 57 |
| Oakwood | 0 | ||||||||
| Redford | 0 | ||||||||
| Maryhill | 1891373 | 3370 | $1,575,000 | $1,575,000 | $1,820,000 | 115.56% | $540.06 | 4/7/22 | 4 |
| Maryhill | 1911466 | 3360 | $1,895,000 | $1,895,000 | $1,895,000 | 100.00% | $563.99 | 5/13/22 | 7 |
| Maryhill | 1944158 | 3399 | $1,825,000 | $1,825,000 | $1,765,000 | 96.71% | $519.27 | 8/8/22 | 16 |
| Maryhill | 2005645 | 3360 | $1,798,000 | $1,798,000 | $1,650,000 | 91.77% | $491.07 | 12/8/22 | 14 |
| Total Volume | |||||||||
| Totals: | Resale | Short Sale | REO | Unlisted | FSBO | ARCH | Total Resale | ||
| 66 | 3 | 3 | 72 |

Invite the Most Experienced Broker in Trilogy Get it Done…
…Sell Your Home the Elephant Way… Call Today!
- Get more for your home by upgrading with NO UP-FRONT FEES & YOU DON’T PAY UNTIL IT’S SOLD.
- Remodeling, Flooring, New Roof, Kitchen or Bath Upgrades, New Fence or Deck, Paint or Whatever.
- Complimentary Quick Stage for Furnished Homes.
- Online Auction Connection to Sell your Wares. 67
- High-Definition Magazine Quality Photography
- Matterport 3-Dimensional Walk-Through Link
- Twilight & Drone Photography Available
- Your Own Personal Property Website
- Automatic Showing Broker Surveys and Feedback
- Social Media Marketing
- E-Marketing Flyer to Thousands of Area Agents
- Full Color, Four-Page, Glossy Property Brochures
- Night Reflective Signage
- Lighted Flyer Box
- Excellent Communication & Personal Attention
- The Protection During Buyer General Inspections of a Knowledgeable Former Shea Homes Top Broker and Designated Broker. (I understand the infrastructure, how the homes, retaining walls, drainage, attached home partitions, etc. are built. I helped supervise the construction of over 1,000 Trilogy homes and Inspectors can’t pull anything over on me.)
- Serving Trilogy Since 2003
- 400+ Trilogy Home Personal Sales – Hands Down More than Anyone.
- Certified Luxury Home Marketing Specialist – Guild Member (CLHMS)
- Five Star Professional Award Recipient 11 Years Running (Top .5%) –Seattle Magazine- December 2022 Issue
- Accredited Buyer’s Representative (ABR Designation)

Please, like Us on Facebook @ Facebook.com/DevinSanfordHomes.com

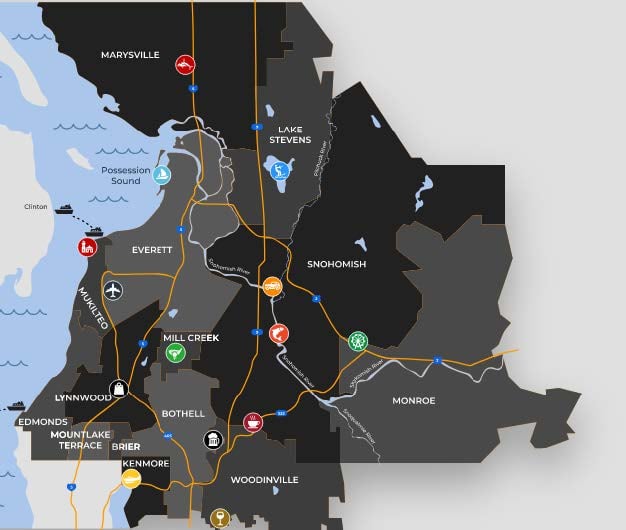
MY HOMETOWN STOMPING GROUNDSI’M BORN AND RAISED IN THIS AREA AND LOVE IT!
It was mostly woods when I grew up in Lynnwood where we rode our sleds down 196th Street and my childhood home is now a Wells Fargo Bank, and our motorcycle riding grounds are the Alderwood Mall and an array of businesses. I grew up in the Edmonds School District and went swimming at Mukilteo and Edmonds beaches, lived in Woodinville and ran Track for Monroe then graduated from Inglemoor High School in Bothell. As an adult I’ve lived in Everett, Mill Creek, Monroe and on Lake Stevens. If you or someone you know need a Snohomish County Expert, I’d be delighted to hear from you.
NOTICE: – If you’d like to join the hundreds of Trilogy Members who get these monthly reports DAYS SOONER via E-Newsletter, join at www.DevinSanfordHomes.com under the “ABOUT” tab and we’d be happy to add you to our list of in the know recipients.
Specializing in Trilogy at Redmond Ridge, Prime Properties, Waterfront & Estates for 23 years.

Read 106 Five Star Reviews at www.zillow.com!

www.SeattleMagazine.com
Award-winning real estate agents in greater Seattle
Five Star… the definition of professional excellence
This award represents 1/2 of 1% of all Real Estate Professionals to have won this award for 11 years.
Find Devin’s 11th consecutive Five-Star Professional award in SEATTLE Magazine’s December 2022 Issue.
That’s a wrap for 2022.
If I may serve you in any way, please, don’t hesitate to reach out. Ensure success with rock-solid representation and “Trunk it!”